
Volume 26, Issue 2 (Summer 2025)
jrehab 2025, 26(2): 166-187 |
Back to browse issues page


![]()
![]()
![]()
Download citation:
BibTeX | RIS | EndNote | Medlars | ProCite | Reference Manager | RefWorks
Send citation to:


BibTeX | RIS | EndNote | Medlars | ProCite | Reference Manager | RefWorks
Send citation to:
Moradi F, Kazemi-Karyani A, Karami Matin B, Soltani P, Kamali M, Jalili F et al . Socioeconomic Disparities in the Prevalence of Disability in Iran: A Decomposition Analysis Using the Concentration Index. jrehab 2025; 26 (2) :166-187
URL: http://rehabilitationj.uswr.ac.ir/article-1-3473-en.html
URL: http://rehabilitationj.uswr.ac.ir/article-1-3473-en.html
Fardin Moradi1 

 , Ali Kazemi-Karyani1 , Behzad Karami Matin1 , Pegah Soltani1 , Mohammad Kamali2 , Faramarz Jalili3 , Shahin Soltani *4
, Ali Kazemi-Karyani1 , Behzad Karami Matin1 , Pegah Soltani1 , Mohammad Kamali2 , Faramarz Jalili3 , Shahin Soltani *4
1- Research Center for Environmental Determinants of Health, Health Institute, Kermanshah University of Medical Sciences, Kermanshah, Iran.
2- Rehabilitation Research Center, School of Rehabilitation Sciences, Iran University of Medical Sciences, Tehran, Iran.
3- School of Health Administration, Dalhousie University, Halifax, NS, Canada.
4- Research Center for Environmental Determinants of Health, Health Institute, Kermanshah University of Medical Sciences, Kermanshah, Iran. & Student Research Committee, Kermanshah University of Medical sciences, Kermanshah, Iran. ,shahin.soltani@kums.ac.ir
2- Rehabilitation Research Center, School of Rehabilitation Sciences, Iran University of Medical Sciences, Tehran, Iran.
3- School of Health Administration, Dalhousie University, Halifax, NS, Canada.
4- Research Center for Environmental Determinants of Health, Health Institute, Kermanshah University of Medical Sciences, Kermanshah, Iran. & Student Research Committee, Kermanshah University of Medical sciences, Kermanshah, Iran. ,
Full-Text [PDF 2024 kb]
(1104 Downloads)
| Abstract (HTML) (3308 Views)
Full-Text: (1061 Views)
Introduction
Disability is defined by the interplay between individuals with health conditions (such as spinal cord injury, blindness, hearing loss, etc.) and various personal and environmental factors, including inaccessible infrastructure, barriers in public transport, social misconceptions, discrimination, and inadequate social support. The World Health Organization (WHO) reports that about 15% of the global population lives with some form of disability. Among these individuals, approximately 2% to 4% encounter considerable challenges in carrying out daily activities [1].
Different factors, such as injuries, health conditions (diabetes, low birth weight), demographics (older ages), the environment (lack of essential dietary nutrients), and socioeconomic factors (lack of affordability), can increase the risk of disability [2-5]. For instance, research indicates that global aging significantly impacts disability trends, reflecting a lifetime accumulation of health risks from chronic illnesses, injuries, and diseases [6-8]The World Health Survey estimates that the prevalence of disability among females is nearly 60% higher than males. Also, surveys show a higher prevalence of disabilities in high-income countries than in middle- and low-income countries [1]. In Iran, disability affects approximately 1% to 4% of the population [9].
The law on the protection of the rights of persons with disabilities enacted in Iran in 2018 can play a vital role in guaranteeing equal access to healthcare and rehabilitation services for individuals with disabilities. This legislation mandates various ministries, governmental organizations, and public institutions to implement accessibility measures, allowing individuals with disabilities to enjoy public facilities and services without barriers [10]. Key aspects include making physical spaces, transportation, information, education, and employment accessible, with a focus on integrating individuals with disabilities into all aspects of public life. This inclusive approach is designed to create an environment where people with disabilities have the same opportunities as others to participate in society.
Additionally, this law holds specific provisions for healthcare and rehabilitation access, particularly through the Ministry of Health, which must ensure comprehensive insurance coverage for individuals with disabilities. This coverage is essential to include medical and physical/mental rehabilitation services. Furthermore, the act highlights support for families of individuals with severe disabilities, offering caregiver compensation or services through public and private centers. By ensuring these health and social support mechanisms, the legislation aims to enhance the quality of life for persons with disabilities and their families. However, they still face significant obstacles in accessing healthcare [11-13].
Investigating socioeconomic inequality in the prevalence of disability in Iran is essential for fostering a more equitable and inclusive society. Various factors, such as income and education levels, as aspects of SES, can impact disability prevalence [14, 15]. By examining these disparities, policymakers can identify and address the root causes that disproportionately affect marginalized communities. This understanding enables the creation of targeted interventions that can reduce the incidence of disability and improve support for those affected. Moreover, tackling these inequalities is essential to guarantee that everyone, irrespective of SES, has equitable access to opportunities, resources, and a good quality of life. Such an investigation not only promotes social justice but also contributes to the development of comprehensive public health strategies that can lead to sustainable and inclusive growth for the nation.
To the best of the authors’ knowledge, only one study has investigated socioeconomic disparities among people with disabilities in Iran. Moradi et al. [13] found substantial disparities in socioeconomic status (SES) across various disability types; poorer provinces reported a higher prevalence of deafness, blindness, speech disorders, and hand impairments compared to wealthier provinces [16]. At the global level, Hosseinpoor et al. [11] using the World Health Survey 2002-2004, found that disability was more concentrated among populations with lower wealth [14]. Similarly, the findings of Zitko Melo and Cabieses Valdes, in Chile, showed that lower SES increased the risk of disabilities among participants [17].
To the best of our knowledge, this is the first study to report on socioeconomic inequalities in disability using data from a national survey in Iran. We pursued two main objectives in this study. At first, we estimate the socioeconomic-related inequalities in the prevalence of disabilities using the concentration index, focusing on data from Iran in 2011. Second, we identify and highlight the major contributors to these socioeconomic inequalities in disability prevalence.
Materials and Methods
Study design
This study conducted a secondary analysis using data from Iran’s 2011 Multiple Indicator Demographic and Health Survey (IrMIDHS). This cross-sectional survey applied a multi-stage, stratified cluster sampling method, and data collection was carried out through face-to-face interviews within households [18].
Study population
The sampling framework was based on Iran’s 2006 population and housing census, with provincial sample sizes ranging from 400 to 6,400 households, with Tehran City, Iran, having the largest sample. Each cluster included 10 households, resulting in a total of 3,096 clusters (909 rural, 2 187 urban) and 30 960 households. Overall, the survey included data from 86 403 participants across Iran [18].
Data collection
The IrMIDHS employed three specific questionnaires for data collection. A household questionnaire was given to a knowledgeable adult who could provide information about all members of the household. For women aged 15-54 years, a specific questionnaire was used to gather relevant data, while for children under five, the questionnaire was directed to the mother or primary caregiver within the household.
Verbal consent was obtained from all eligible participants before each interview. The survey process was approved by various ethical bodies, including the Ethics Committee of Tehran University of Medical Sciences, the information office of the ministry of health and medical education (MoHME), the Review Board of the Statistical Center of Iran, and the Policy Council and Board of Deputies at MoHME [18].
Before data collection, pamphlets were distributed to sampled households at least one day in advance. These pamphlets explained that participants were free to join or withdraw from the study at any point. More detailed information about the IrMIDHS protocol is available in the study by Rashidian et al and on the National Institute for Health Research website [15, 16].
Study variables
The main outcome variable in this study was the presence of a disability (1: Yes and 0: No), which was defined in the survey as any loss or abnormality of emotional, mental, physiological, or anatomical structure or function [18-20]. Disabilities were self-reported and categorized into intellectual, hearing, vision, and physical types, with responses recorded as binary (yes/no) based on the question, “Do you experience any physical or mental health conditions?”
Demographic variables covered age, gender, location (urban or rural), education, and wealth index. SES was determined using available data on asset ownership (such as personal computer, refrigerator, stove, washing machine, vacuum cleaner, sewing machine, and car), features and attributes of a living space (such as ownership status and house size), and participants’ education levels. The SES indicator was derived by combining household assets and education levels through principal components analysis [21], which helped simplify the data by reducing multiple asset variables into a single SES indicator. This approach enabled the categorization of the study participants into five SES quantiles (first quintile [the lowest] to fifth quintile [the highest]).
Statistical analysis
In the present study, socioeconomic-related inequality in disability prevalence was calculated using the concentration index to estimate inequality related to SES within the study population. This index assesses inequality by comparing the distribution of one variable (disability prevalence) across the spectrum of another variable (SES) [22].
The concentration index ranges from -1 to +1. Accordingly, a positive value signifies a higher prevalence of disabilities in higher-SES groups, whereas a negative value demonstrates a concentration of disabilities in lower-SES groups. A concentration index of zero reflects an equal distribution of disability across SES groups [23-25]. The concentration index is calculated using a “convenient covariance” Eqouation 1 [26]:

This index was normalized using Wagstaff’s method to account for this limitation (Eqouation 2) [27]:

Decomposition analysis of socioeconomic inequality in the prevalence of disabilities
This study also explored socioeconomic inequality in disability prevalence by decomposing the concentration index, which measures the contribution of specific socioeconomic factors to the overall inequality. Following the Wagstaff method, the relationship between disability prevalence and several explanatory variables is modeled [28]. This approach allows each factor’s contribution to be identified, with positive values indicating that a variable’s distribution and effect increase disability concentration among higher socioeconomic groups.
The decomposition formula divides the concentration index into two parts: the first captures the contributions of explanatory variables, while the second represents the unexplained variance, or socioeconomic inequality not accounted for by these factors. For accurate results, given the binary nature of disability, an adjustment by Wagstaff is applied, using logistic regression-derived marginal effects as coefficients [24, 25, 28]. For further details on the concentration index and decomposition analysis, refer to previous studies [29, 30]. Conducted with Stata 14.2, this analysis highlights key socioeconomic determinants of disability and the remaining inequality, providing valuable insights for policy to address these disparities effectively.
Results
Among the 111 416 Iranian participants initially surveyed, 86 403 individuals were included in the final analysis after excluding 25 013 participants due to missing socioeconomic or disability data. The participants’ ages ranged from 1 to 95 years, with a Mean±SD of 28.88±0.06. Of those included, 44534(51.34%) were male and 61774(71.50%) resided in urban areas. In terms of educational attainment, 13347 individuals (15.45%) had an academic degree. In Table 1, the demographic characteristics of the study participants are summarized.

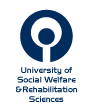
The overall prevalence of disability within this sample was 6.29% (n=5 432). Table 2 provides a summary of demographic characteristics. Specifically, 0.21% (n=184) reported visual impairment, 0.14% (n=123) had hearing loss, 0.8% (n=693) experienced physical disabilities, 0.37% (n=322) had intellectual disabilities, and 0.26% (n=211) reported other disabilities.
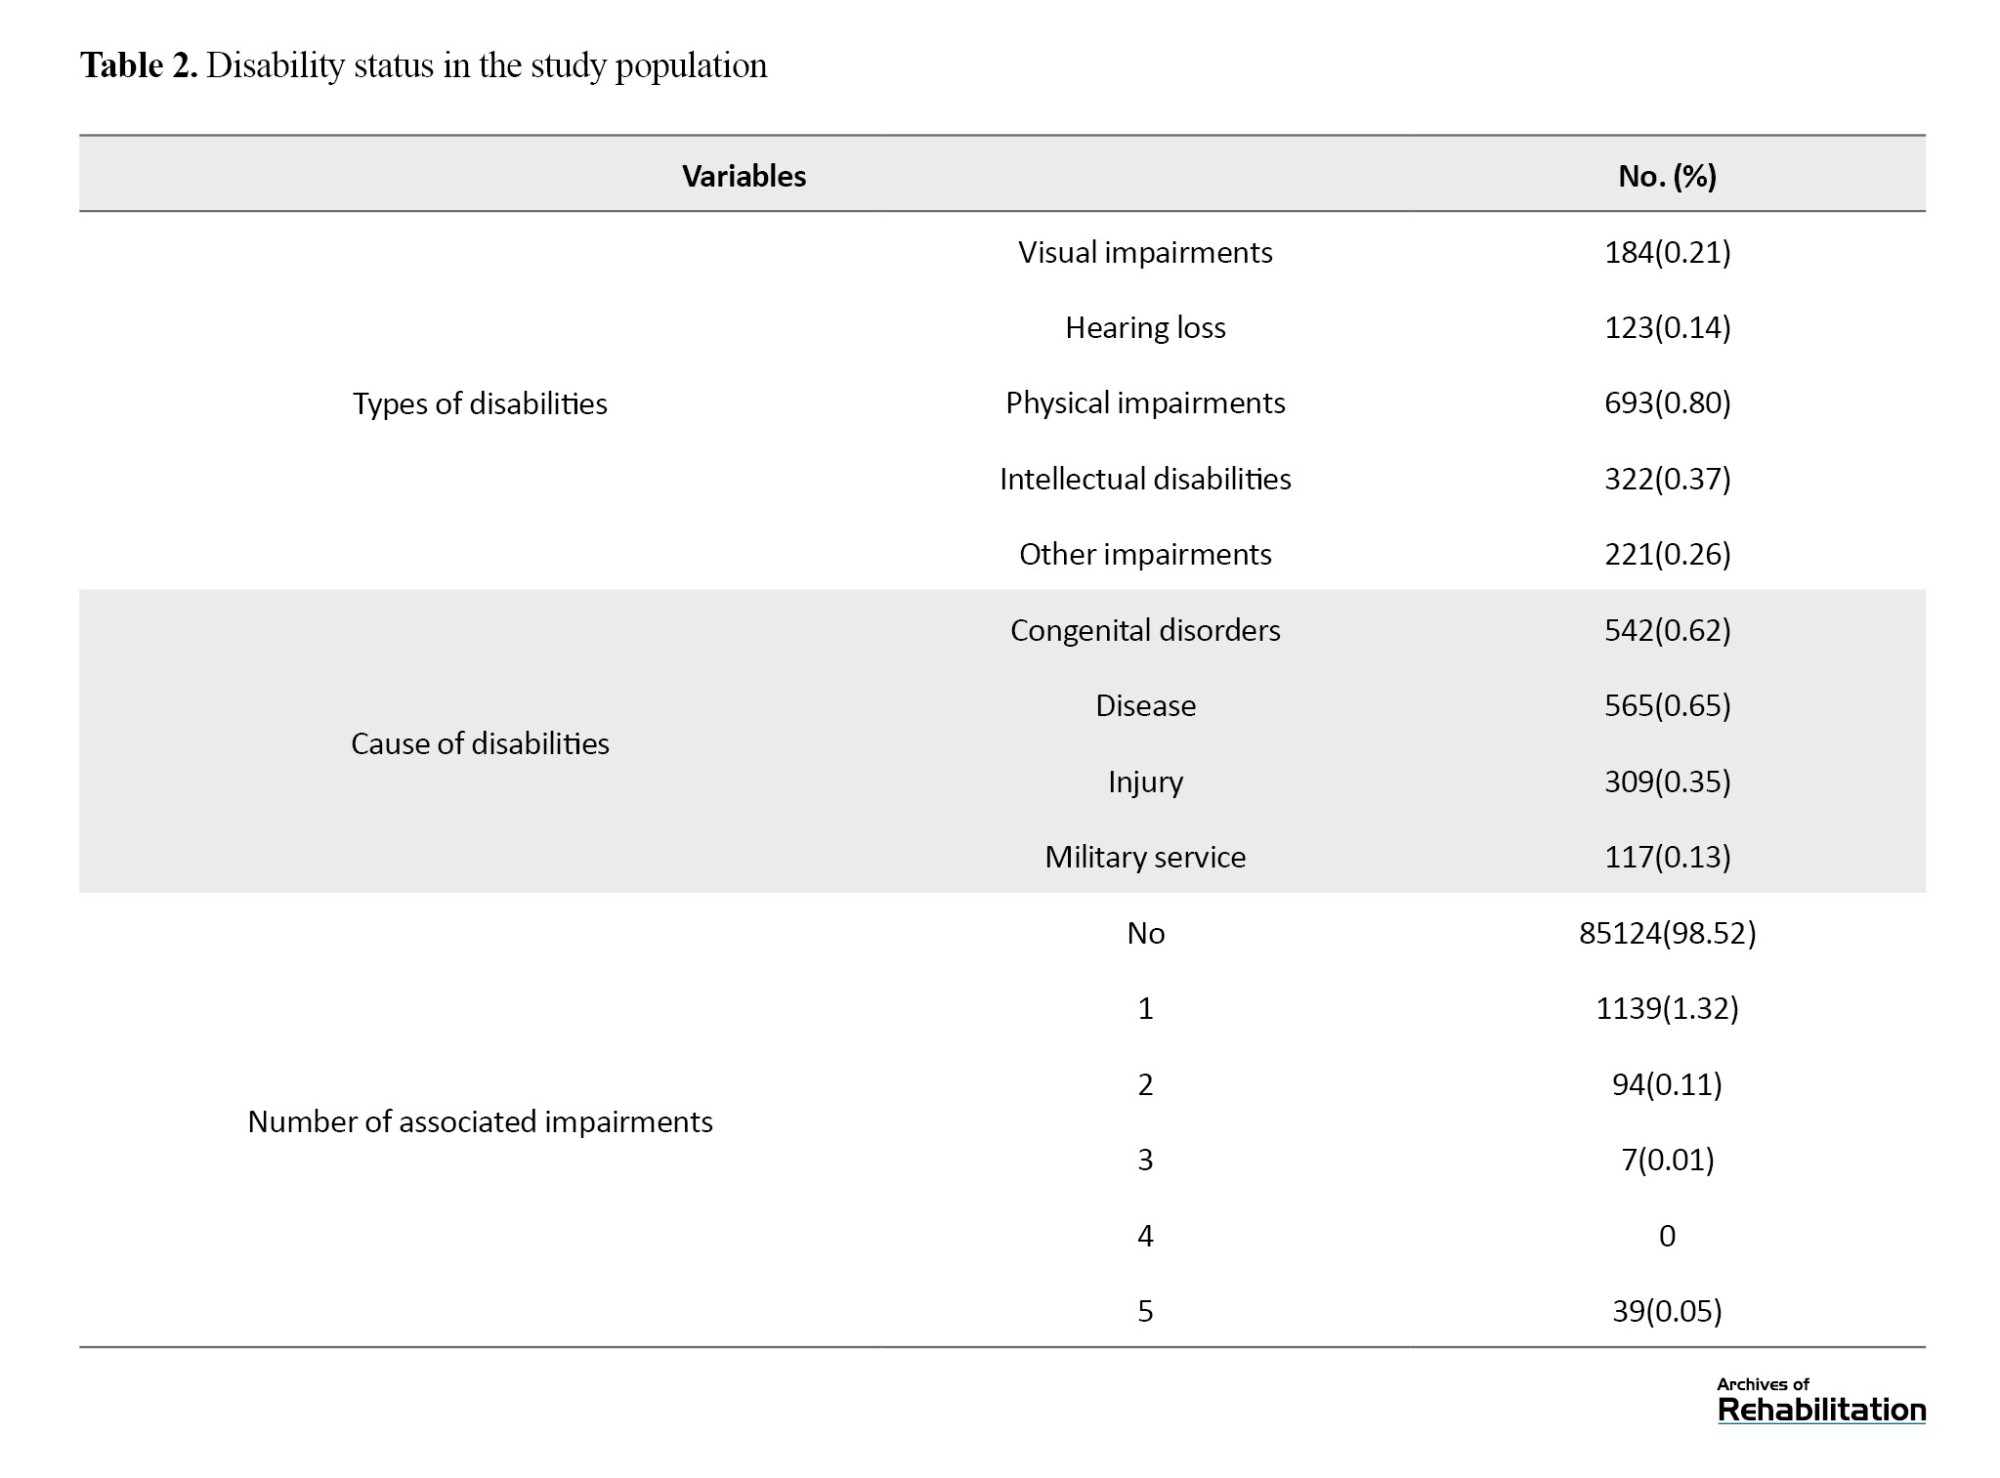
To analyze socioeconomic disparities in disability prevalence, we estimated the concentration index=0.15 (P<0.001), indicating that disability prevalence was higher among participants with higher SES, as illustrated by the Lorenz curve in Figure 1.
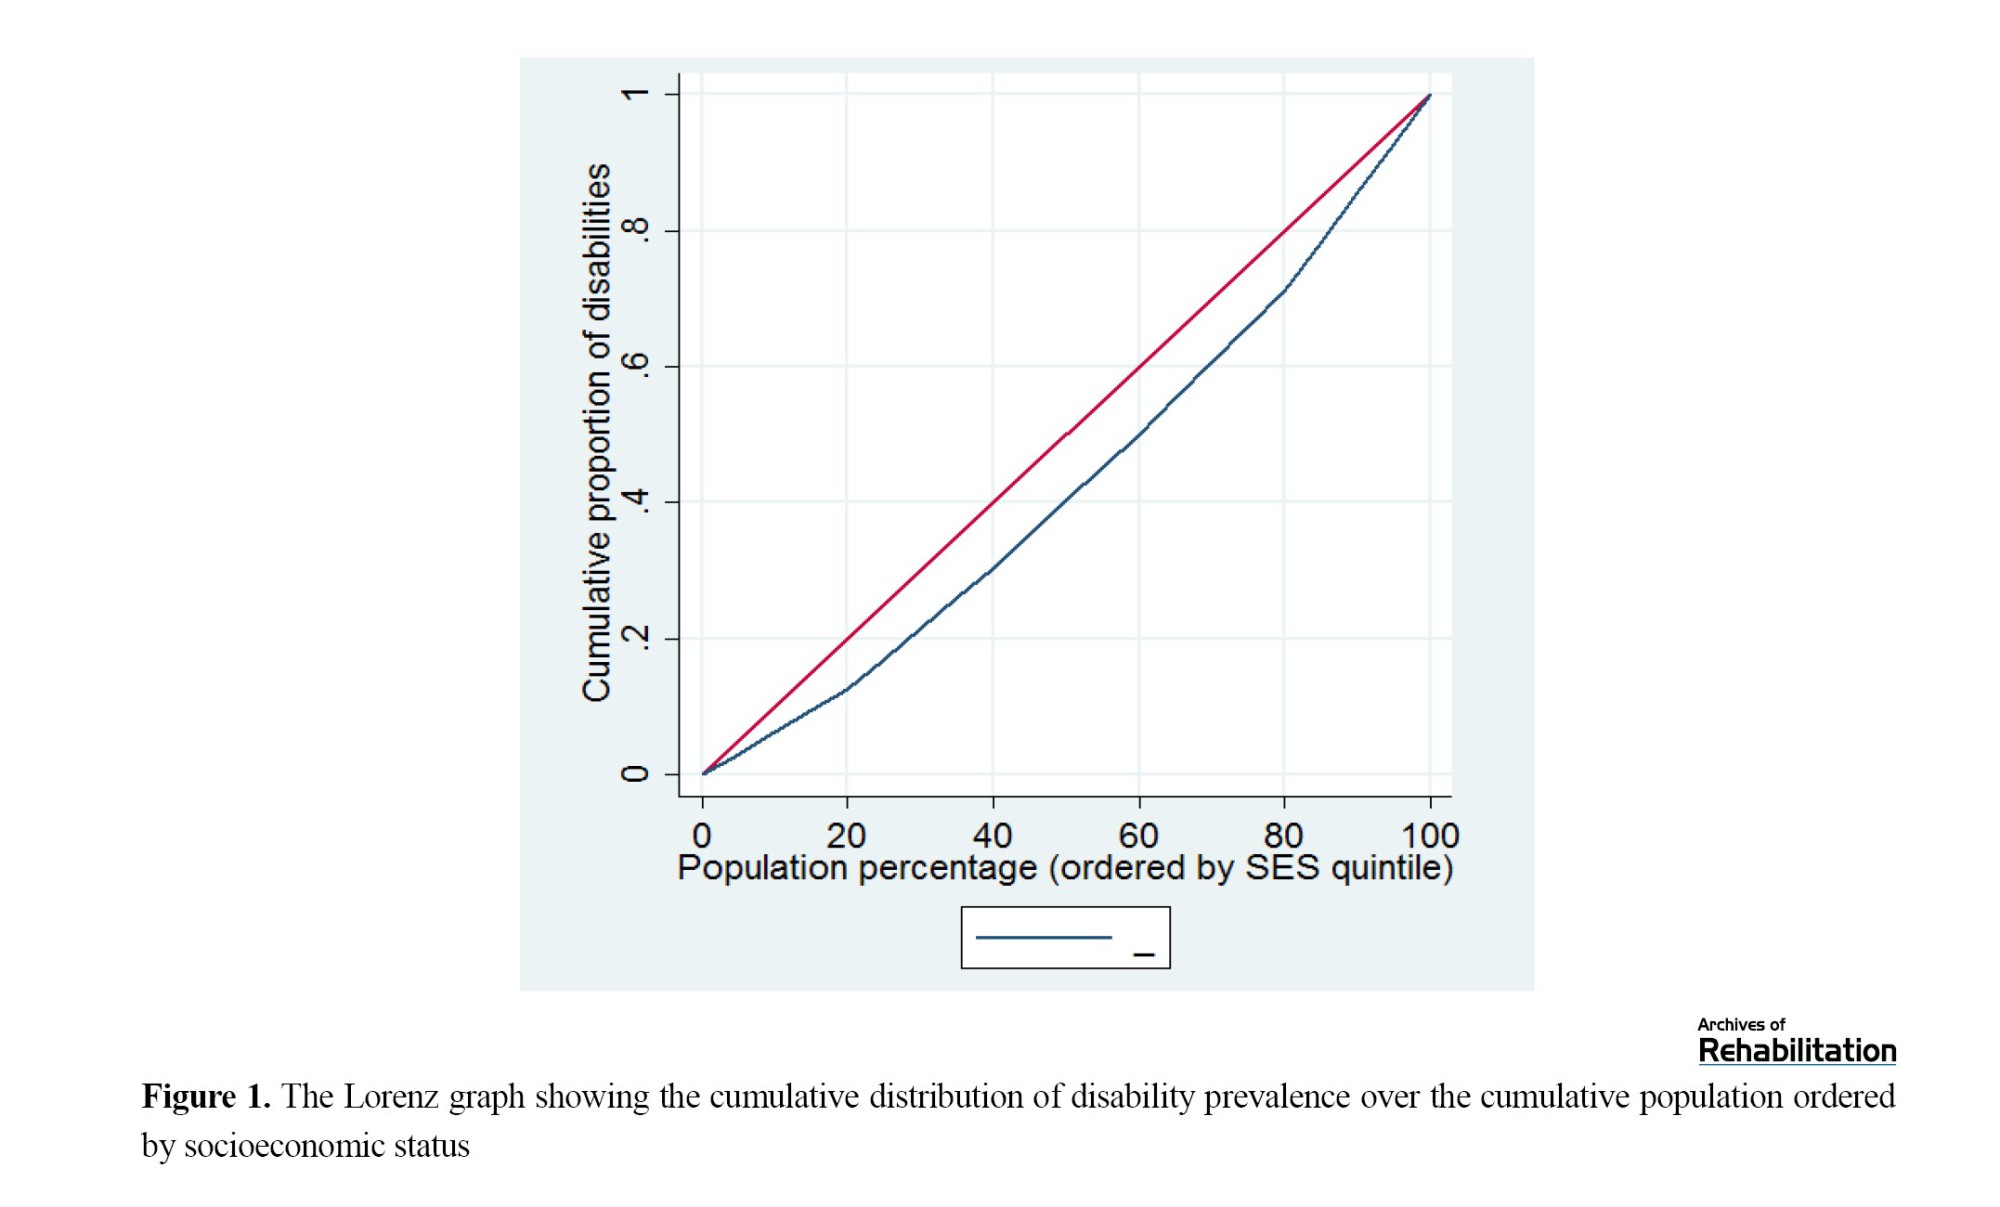
The analysis further considered gender- and age-specific disparities, revealing positive, statistically significant concentration indices for both males (0.15, P<0.001) and females (0.14, P<0.001), indicating that disability prevalence was similarly skewed by SES for both genders (Figure 2).
Examining age groups, disability prevalence was significantly concentrated among individuals of higher SES across all age categories, as depicted by the Lorenz curves in Figure 3.

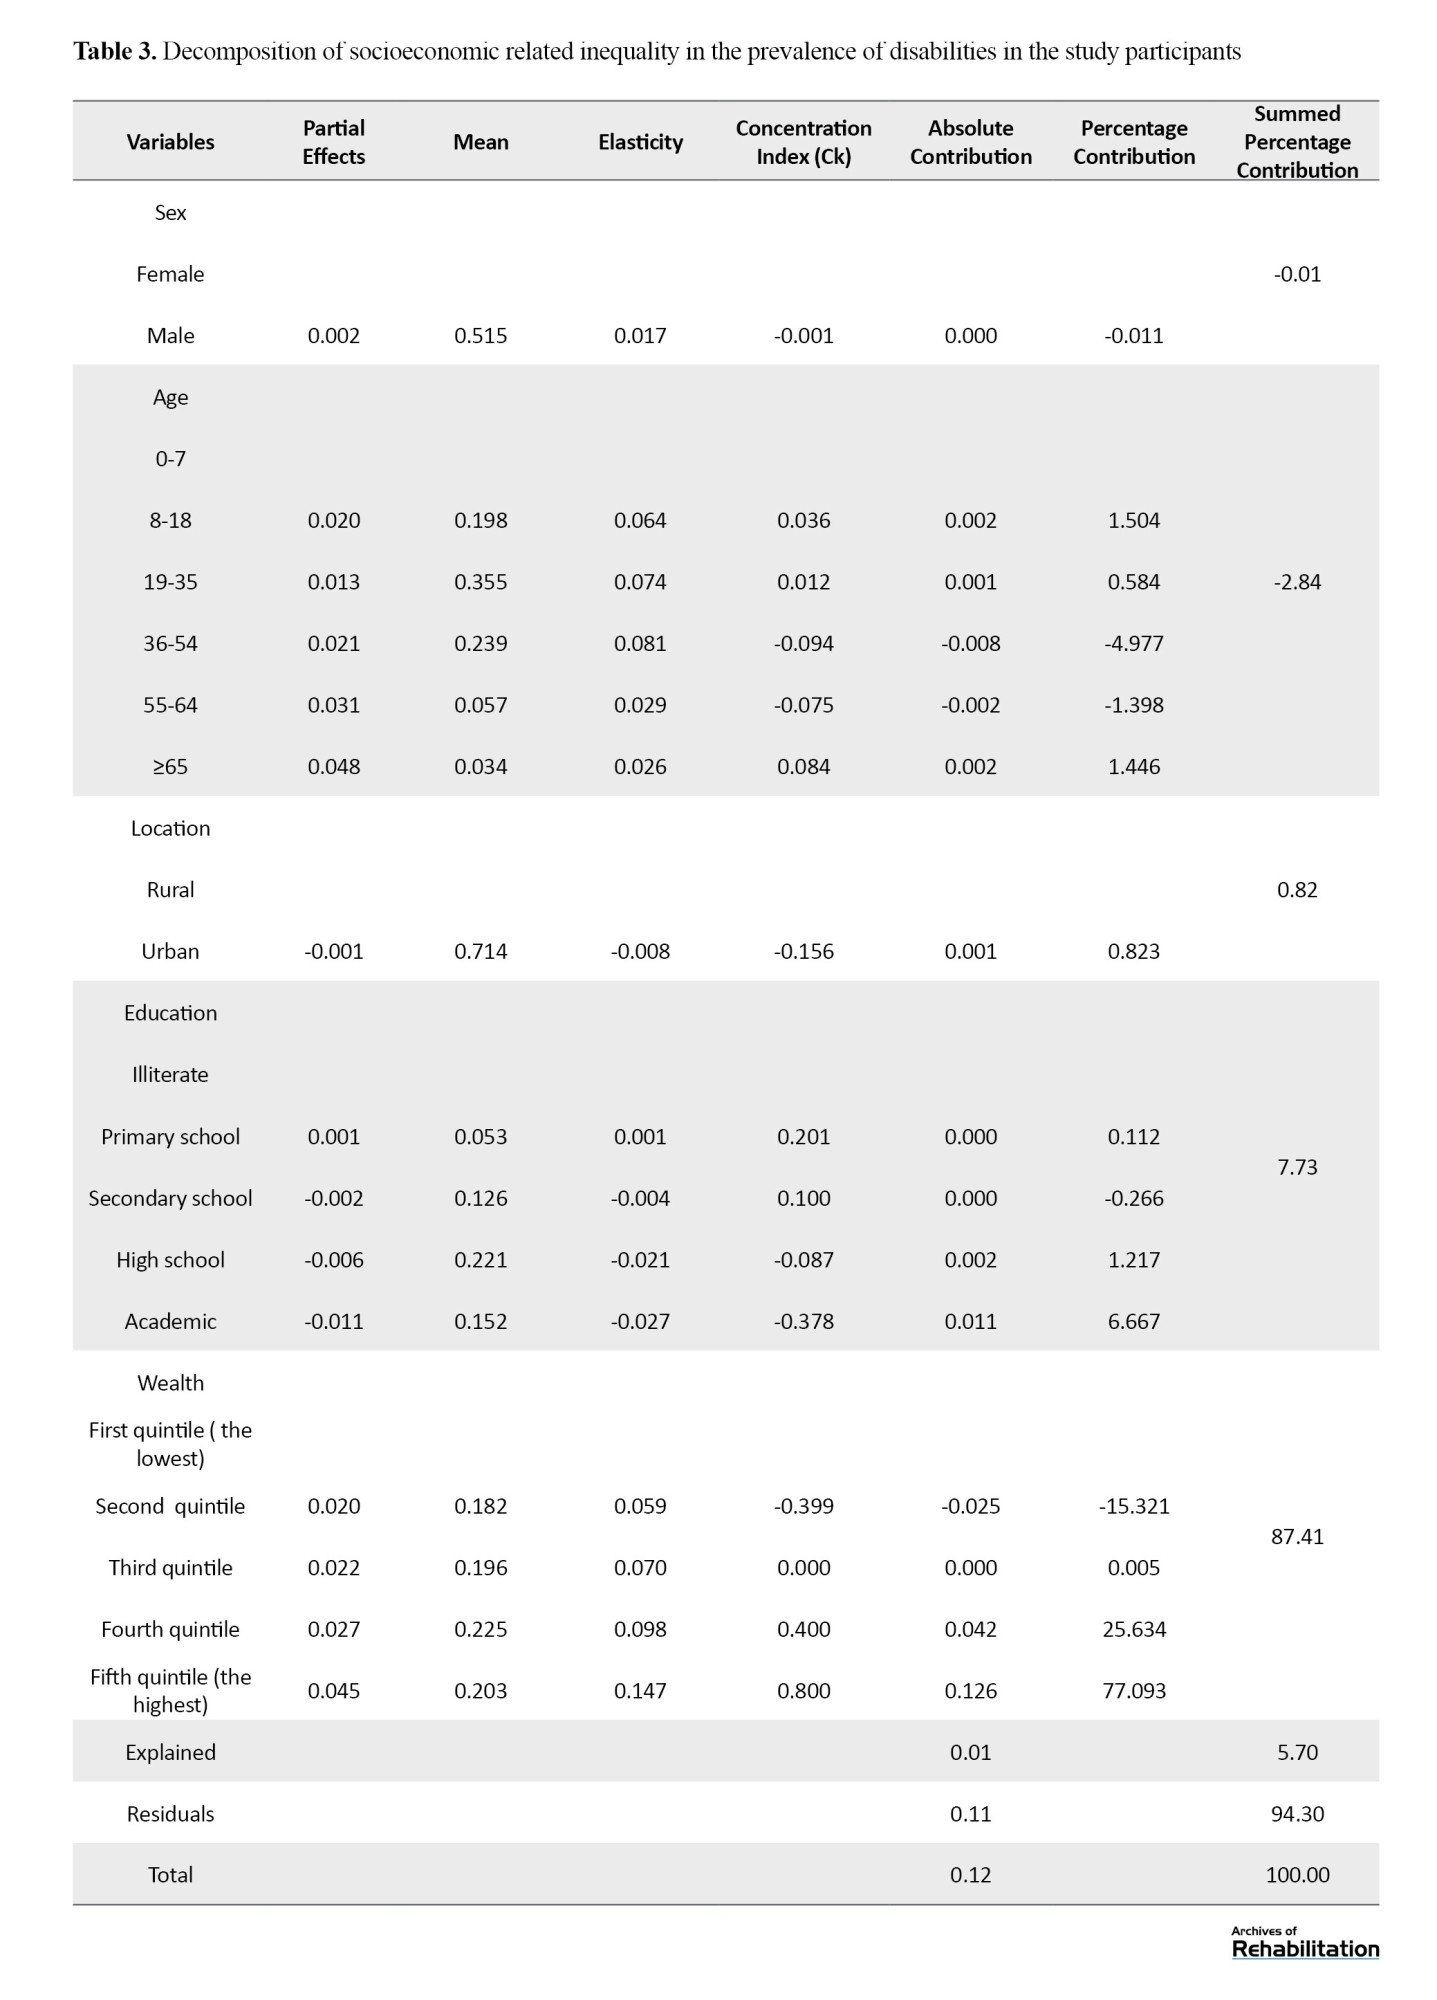
The decomposition analysis of SES inequalities in disability prevalence, shown in Table 3, identified wealth index as the most substantial contributing factor, accounting for 87.41% of the overall socioeconomic inequality in disability prevalence. Educational attainment contributed an additional 7.73% to the observed socioeconomic disparities among those with disabilities.
Discussion
In the present study, we used the concentration index to examine socioeconomic gradients among individuals with disabilities in Iran. The results showed that disabilities were more prevalent among those with higher SES. Literature shows mixed results for the impacts of SES on the prevalence of disabilities. For example, Moradi et al. in Iran, found that the rate of disabilities was significantly higher among individuals who were illiterate and unemployed [16]. Mansouri et al. [27] discovered that individuals with lower economic status experienced a greater concentration of poorer visual acuity. Another study by Emamian et al. indicated that visual impairments were more prevalent among those with a lower SES [28].
Multiple factors, such as the kind of disability, access to diagnosis and reporting services, occupational hazards, aging population, lifestyle factors, survivor bias, better awareness and self-advocacy, and psychosocial factors, could potentially explain this outcome [29-35]. For example, a study by Thomas et al. (2011) in the United States suggested that the prevalence of autism is higher among wealthier groups, potentially due to differences in access to pediatric and developmental services [29]. Individuals with higher SES often have better access to healthcare services due to financial resources, health insurance, and proximity to high-quality medical facilities. This access increases the likelihood of receiving timely and accurate diagnoses of health conditions, including disabilities. In contrast, individuals with lower SES might not seek medical help as frequently or might not afford comprehensive medical evaluations, leading to underreporting or misdiagnosis of disabilities [33, 40].
Higher SES is often associated with longer life expectancy due to better access to healthcare, healthier lifestyles, and safer living conditions. As people age, the likelihood of developing disabilities increases. Therefore, a concentration of disabilities among older adults with higher SES might be observed because these individuals live longer and are more likely to experience age-related disabilities [34, 35].
In addition, some lifestyle choices that are more prevalent among higher SES individuals can contribute to the development of disabilities. For example, sedentary lifestyles, high levels of stress, and certain leisure activities can lead to conditions like obesity, cardiovascular diseases, and mental health issues. These conditions can eventually contribute to various forms of disability [36, 41].
The present study revealed that the wealth index was the primary contributor to socioeconomic inequality among individuals with disabilities, underscoring its significant role in the uneven distribution of disability within the study population. The positive contribution arises from both the favorable concentration index for wealth quintiles and the positive elasticity of all disability measures concerning wealth quintiles. In other words, participants in higher wealth quintiles tend to be richer and have higher rates of disability than their counterparts in lower wealth quintiles, resulting in a positive association between disability and income.
Various studies have highlighted the effect of SES on the prevalence of disabilities in populations. For example, a systematic review by Rammadas et al. in India found that economic dependence is linked to a higher prevalence of activity limitations, impairment, and participation restrictions [38].
The decomposition analysis revealed that education had a positive influence on socioeconomic inequality in the prevalence of disabilities. This means that differences in educational attainment among various socioeconomic groups contributed to the inequality in disability prevalence. Specifically, individuals with lower levels of education were more likely to experience disabilities, exacerbating the disparity between higher and lower SES groups.
Education impacts various aspects of life, including employment opportunities, income, living conditions, and social support, all of which are determinants of health. Lower educational attainment can lead to a cumulative disadvantage, increasing the risk of disabilities and reinforcing socioeconomic inequalities. Numerous studies have shown a strong correlation between educational attainment and health outcomes. Higher education often leads to better health literacy, healthier lifestyles, and greater access to healthcare resources, which can reduce the likelihood of disabilities [39, 40].
In a 6-year follow-up study in Spain, Zunzunegui et al. found that women and individuals with lower education levels had a higher prevalence of disabilities compared to those with higher education [41]. Nevertheless, some studies found that after adjusting for variables such as gender and age, education was no longer associated with disability [42].
Conclusion
In conclusion, this study revealed a positive socioeconomic inequality in the prevalence of disability in Iran, with a higher concentration among individuals with greater wealth and education. This unexpected pattern may reflect better access to diagnosis, longer life expectancy, and lifestyle-related risk factors among high-SES groups, alongside possible underreporting among low-SES populations. The wealth index was the main driver of this inequality, followed by education. These findings highlight the need for targeted preventive strategies, health monitoring, and further research to understand the underlying causes of disability among wealthier populations, while also improving disability identification and support services for disadvantaged groups.
Study limitations
This study has certain limitations that should be taken into account when interpreting the findings. We used available data and were not able to include other variables in our analysis. The data for this study were drawn from Iran’s 2011 IrMIDHS, with no access to more recent data. Also, we removed data for 25 013 participants because of missing data on socioeconomic and disability status.
Ethical Considerations
Compliance with ethical guidelines
The Ethics Committee of Kermanshah University of Medical Sciences approved this study under the Code of Ethics IR.KUMS.REC.1398.516.
Funding
This research was financially supported by Kermanshah University of Medical Sciences.
Authors' contributions
Conceptualization: Shahin Soltani; Methodology: Shahin Soltani and Behzad Karami Matin; Data cleaning: Pegah Soltani; Data analysis: Mohammad Kamali, Ali Kazemi Karyani, Faramarz Jalili; Drafting the manuscript: Fardin Moradi; Editing and finalizing the manuscript: All authors; Supervision: Behzad Karami Matin; Project Management: Shahin Soltani.
Conflict of interest
The authors declared no conflict of interest.
Acknowledgments
The authors thank the National Institute for Health Research Islamic Republic of Iran for providing data.
Disability is defined by the interplay between individuals with health conditions (such as spinal cord injury, blindness, hearing loss, etc.) and various personal and environmental factors, including inaccessible infrastructure, barriers in public transport, social misconceptions, discrimination, and inadequate social support. The World Health Organization (WHO) reports that about 15% of the global population lives with some form of disability. Among these individuals, approximately 2% to 4% encounter considerable challenges in carrying out daily activities [1].
Different factors, such as injuries, health conditions (diabetes, low birth weight), demographics (older ages), the environment (lack of essential dietary nutrients), and socioeconomic factors (lack of affordability), can increase the risk of disability [2-5]. For instance, research indicates that global aging significantly impacts disability trends, reflecting a lifetime accumulation of health risks from chronic illnesses, injuries, and diseases [6-8]The World Health Survey estimates that the prevalence of disability among females is nearly 60% higher than males. Also, surveys show a higher prevalence of disabilities in high-income countries than in middle- and low-income countries [1]. In Iran, disability affects approximately 1% to 4% of the population [9].
The law on the protection of the rights of persons with disabilities enacted in Iran in 2018 can play a vital role in guaranteeing equal access to healthcare and rehabilitation services for individuals with disabilities. This legislation mandates various ministries, governmental organizations, and public institutions to implement accessibility measures, allowing individuals with disabilities to enjoy public facilities and services without barriers [10]. Key aspects include making physical spaces, transportation, information, education, and employment accessible, with a focus on integrating individuals with disabilities into all aspects of public life. This inclusive approach is designed to create an environment where people with disabilities have the same opportunities as others to participate in society.
Additionally, this law holds specific provisions for healthcare and rehabilitation access, particularly through the Ministry of Health, which must ensure comprehensive insurance coverage for individuals with disabilities. This coverage is essential to include medical and physical/mental rehabilitation services. Furthermore, the act highlights support for families of individuals with severe disabilities, offering caregiver compensation or services through public and private centers. By ensuring these health and social support mechanisms, the legislation aims to enhance the quality of life for persons with disabilities and their families. However, they still face significant obstacles in accessing healthcare [11-13].
Investigating socioeconomic inequality in the prevalence of disability in Iran is essential for fostering a more equitable and inclusive society. Various factors, such as income and education levels, as aspects of SES, can impact disability prevalence [14, 15]. By examining these disparities, policymakers can identify and address the root causes that disproportionately affect marginalized communities. This understanding enables the creation of targeted interventions that can reduce the incidence of disability and improve support for those affected. Moreover, tackling these inequalities is essential to guarantee that everyone, irrespective of SES, has equitable access to opportunities, resources, and a good quality of life. Such an investigation not only promotes social justice but also contributes to the development of comprehensive public health strategies that can lead to sustainable and inclusive growth for the nation.
To the best of the authors’ knowledge, only one study has investigated socioeconomic disparities among people with disabilities in Iran. Moradi et al. [13] found substantial disparities in socioeconomic status (SES) across various disability types; poorer provinces reported a higher prevalence of deafness, blindness, speech disorders, and hand impairments compared to wealthier provinces [16]. At the global level, Hosseinpoor et al. [11] using the World Health Survey 2002-2004, found that disability was more concentrated among populations with lower wealth [14]. Similarly, the findings of Zitko Melo and Cabieses Valdes, in Chile, showed that lower SES increased the risk of disabilities among participants [17].
To the best of our knowledge, this is the first study to report on socioeconomic inequalities in disability using data from a national survey in Iran. We pursued two main objectives in this study. At first, we estimate the socioeconomic-related inequalities in the prevalence of disabilities using the concentration index, focusing on data from Iran in 2011. Second, we identify and highlight the major contributors to these socioeconomic inequalities in disability prevalence.
Materials and Methods
Study design
This study conducted a secondary analysis using data from Iran’s 2011 Multiple Indicator Demographic and Health Survey (IrMIDHS). This cross-sectional survey applied a multi-stage, stratified cluster sampling method, and data collection was carried out through face-to-face interviews within households [18].
Study population
The sampling framework was based on Iran’s 2006 population and housing census, with provincial sample sizes ranging from 400 to 6,400 households, with Tehran City, Iran, having the largest sample. Each cluster included 10 households, resulting in a total of 3,096 clusters (909 rural, 2 187 urban) and 30 960 households. Overall, the survey included data from 86 403 participants across Iran [18].
Data collection
The IrMIDHS employed three specific questionnaires for data collection. A household questionnaire was given to a knowledgeable adult who could provide information about all members of the household. For women aged 15-54 years, a specific questionnaire was used to gather relevant data, while for children under five, the questionnaire was directed to the mother or primary caregiver within the household.
Verbal consent was obtained from all eligible participants before each interview. The survey process was approved by various ethical bodies, including the Ethics Committee of Tehran University of Medical Sciences, the information office of the ministry of health and medical education (MoHME), the Review Board of the Statistical Center of Iran, and the Policy Council and Board of Deputies at MoHME [18].
Before data collection, pamphlets were distributed to sampled households at least one day in advance. These pamphlets explained that participants were free to join or withdraw from the study at any point. More detailed information about the IrMIDHS protocol is available in the study by Rashidian et al and on the National Institute for Health Research website [15, 16].
Study variables
The main outcome variable in this study was the presence of a disability (1: Yes and 0: No), which was defined in the survey as any loss or abnormality of emotional, mental, physiological, or anatomical structure or function [18-20]. Disabilities were self-reported and categorized into intellectual, hearing, vision, and physical types, with responses recorded as binary (yes/no) based on the question, “Do you experience any physical or mental health conditions?”
Demographic variables covered age, gender, location (urban or rural), education, and wealth index. SES was determined using available data on asset ownership (such as personal computer, refrigerator, stove, washing machine, vacuum cleaner, sewing machine, and car), features and attributes of a living space (such as ownership status and house size), and participants’ education levels. The SES indicator was derived by combining household assets and education levels through principal components analysis [21], which helped simplify the data by reducing multiple asset variables into a single SES indicator. This approach enabled the categorization of the study participants into five SES quantiles (first quintile [the lowest] to fifth quintile [the highest]).
Statistical analysis
In the present study, socioeconomic-related inequality in disability prevalence was calculated using the concentration index to estimate inequality related to SES within the study population. This index assesses inequality by comparing the distribution of one variable (disability prevalence) across the spectrum of another variable (SES) [22].
The concentration index ranges from -1 to +1. Accordingly, a positive value signifies a higher prevalence of disabilities in higher-SES groups, whereas a negative value demonstrates a concentration of disabilities in lower-SES groups. A concentration index of zero reflects an equal distribution of disability across SES groups [23-25]. The concentration index is calculated using a “convenient covariance” Eqouation 1 [26]:
This index was normalized using Wagstaff’s method to account for this limitation (Eqouation 2) [27]:
Decomposition analysis of socioeconomic inequality in the prevalence of disabilities
This study also explored socioeconomic inequality in disability prevalence by decomposing the concentration index, which measures the contribution of specific socioeconomic factors to the overall inequality. Following the Wagstaff method, the relationship between disability prevalence and several explanatory variables is modeled [28]. This approach allows each factor’s contribution to be identified, with positive values indicating that a variable’s distribution and effect increase disability concentration among higher socioeconomic groups.
The decomposition formula divides the concentration index into two parts: the first captures the contributions of explanatory variables, while the second represents the unexplained variance, or socioeconomic inequality not accounted for by these factors. For accurate results, given the binary nature of disability, an adjustment by Wagstaff is applied, using logistic regression-derived marginal effects as coefficients [24, 25, 28]. For further details on the concentration index and decomposition analysis, refer to previous studies [29, 30]. Conducted with Stata 14.2, this analysis highlights key socioeconomic determinants of disability and the remaining inequality, providing valuable insights for policy to address these disparities effectively.
Results
Among the 111 416 Iranian participants initially surveyed, 86 403 individuals were included in the final analysis after excluding 25 013 participants due to missing socioeconomic or disability data. The participants’ ages ranged from 1 to 95 years, with a Mean±SD of 28.88±0.06. Of those included, 44534(51.34%) were male and 61774(71.50%) resided in urban areas. In terms of educational attainment, 13347 individuals (15.45%) had an academic degree. In Table 1, the demographic characteristics of the study participants are summarized.
The overall prevalence of disability within this sample was 6.29% (n=5 432). Table 2 provides a summary of demographic characteristics. Specifically, 0.21% (n=184) reported visual impairment, 0.14% (n=123) had hearing loss, 0.8% (n=693) experienced physical disabilities, 0.37% (n=322) had intellectual disabilities, and 0.26% (n=211) reported other disabilities.
To analyze socioeconomic disparities in disability prevalence, we estimated the concentration index=0.15 (P<0.001), indicating that disability prevalence was higher among participants with higher SES, as illustrated by the Lorenz curve in Figure 1.
The analysis further considered gender- and age-specific disparities, revealing positive, statistically significant concentration indices for both males (0.15, P<0.001) and females (0.14, P<0.001), indicating that disability prevalence was similarly skewed by SES for both genders (Figure 2).
Examining age groups, disability prevalence was significantly concentrated among individuals of higher SES across all age categories, as depicted by the Lorenz curves in Figure 3.
The decomposition analysis of SES inequalities in disability prevalence, shown in Table 3, identified wealth index as the most substantial contributing factor, accounting for 87.41% of the overall socioeconomic inequality in disability prevalence. Educational attainment contributed an additional 7.73% to the observed socioeconomic disparities among those with disabilities.
Discussion
In the present study, we used the concentration index to examine socioeconomic gradients among individuals with disabilities in Iran. The results showed that disabilities were more prevalent among those with higher SES. Literature shows mixed results for the impacts of SES on the prevalence of disabilities. For example, Moradi et al. in Iran, found that the rate of disabilities was significantly higher among individuals who were illiterate and unemployed [16]. Mansouri et al. [27] discovered that individuals with lower economic status experienced a greater concentration of poorer visual acuity. Another study by Emamian et al. indicated that visual impairments were more prevalent among those with a lower SES [28].
Multiple factors, such as the kind of disability, access to diagnosis and reporting services, occupational hazards, aging population, lifestyle factors, survivor bias, better awareness and self-advocacy, and psychosocial factors, could potentially explain this outcome [29-35]. For example, a study by Thomas et al. (2011) in the United States suggested that the prevalence of autism is higher among wealthier groups, potentially due to differences in access to pediatric and developmental services [29]. Individuals with higher SES often have better access to healthcare services due to financial resources, health insurance, and proximity to high-quality medical facilities. This access increases the likelihood of receiving timely and accurate diagnoses of health conditions, including disabilities. In contrast, individuals with lower SES might not seek medical help as frequently or might not afford comprehensive medical evaluations, leading to underreporting or misdiagnosis of disabilities [33, 40].
Higher SES is often associated with longer life expectancy due to better access to healthcare, healthier lifestyles, and safer living conditions. As people age, the likelihood of developing disabilities increases. Therefore, a concentration of disabilities among older adults with higher SES might be observed because these individuals live longer and are more likely to experience age-related disabilities [34, 35].
In addition, some lifestyle choices that are more prevalent among higher SES individuals can contribute to the development of disabilities. For example, sedentary lifestyles, high levels of stress, and certain leisure activities can lead to conditions like obesity, cardiovascular diseases, and mental health issues. These conditions can eventually contribute to various forms of disability [36, 41].
The present study revealed that the wealth index was the primary contributor to socioeconomic inequality among individuals with disabilities, underscoring its significant role in the uneven distribution of disability within the study population. The positive contribution arises from both the favorable concentration index for wealth quintiles and the positive elasticity of all disability measures concerning wealth quintiles. In other words, participants in higher wealth quintiles tend to be richer and have higher rates of disability than their counterparts in lower wealth quintiles, resulting in a positive association between disability and income.
Various studies have highlighted the effect of SES on the prevalence of disabilities in populations. For example, a systematic review by Rammadas et al. in India found that economic dependence is linked to a higher prevalence of activity limitations, impairment, and participation restrictions [38].
The decomposition analysis revealed that education had a positive influence on socioeconomic inequality in the prevalence of disabilities. This means that differences in educational attainment among various socioeconomic groups contributed to the inequality in disability prevalence. Specifically, individuals with lower levels of education were more likely to experience disabilities, exacerbating the disparity between higher and lower SES groups.
Education impacts various aspects of life, including employment opportunities, income, living conditions, and social support, all of which are determinants of health. Lower educational attainment can lead to a cumulative disadvantage, increasing the risk of disabilities and reinforcing socioeconomic inequalities. Numerous studies have shown a strong correlation between educational attainment and health outcomes. Higher education often leads to better health literacy, healthier lifestyles, and greater access to healthcare resources, which can reduce the likelihood of disabilities [39, 40].
In a 6-year follow-up study in Spain, Zunzunegui et al. found that women and individuals with lower education levels had a higher prevalence of disabilities compared to those with higher education [41]. Nevertheless, some studies found that after adjusting for variables such as gender and age, education was no longer associated with disability [42].
Conclusion
In conclusion, this study revealed a positive socioeconomic inequality in the prevalence of disability in Iran, with a higher concentration among individuals with greater wealth and education. This unexpected pattern may reflect better access to diagnosis, longer life expectancy, and lifestyle-related risk factors among high-SES groups, alongside possible underreporting among low-SES populations. The wealth index was the main driver of this inequality, followed by education. These findings highlight the need for targeted preventive strategies, health monitoring, and further research to understand the underlying causes of disability among wealthier populations, while also improving disability identification and support services for disadvantaged groups.
Study limitations
This study has certain limitations that should be taken into account when interpreting the findings. We used available data and were not able to include other variables in our analysis. The data for this study were drawn from Iran’s 2011 IrMIDHS, with no access to more recent data. Also, we removed data for 25 013 participants because of missing data on socioeconomic and disability status.
Ethical Considerations
Compliance with ethical guidelines
The Ethics Committee of Kermanshah University of Medical Sciences approved this study under the Code of Ethics IR.KUMS.REC.1398.516.
Funding
This research was financially supported by Kermanshah University of Medical Sciences.
Authors' contributions
Conceptualization: Shahin Soltani; Methodology: Shahin Soltani and Behzad Karami Matin; Data cleaning: Pegah Soltani; Data analysis: Mohammad Kamali, Ali Kazemi Karyani, Faramarz Jalili; Drafting the manuscript: Fardin Moradi; Editing and finalizing the manuscript: All authors; Supervision: Behzad Karami Matin; Project Management: Shahin Soltani.
Conflict of interest
The authors declared no conflict of interest.
Acknowledgments
The authors thank the National Institute for Health Research Islamic Republic of Iran for providing data.
References
- World Health Organization (WHO). World report on disability 2011. Geneva: World Health Organization; 2011. [Link]
- Chiurazzi P, Kiani AK, Miertus J, Paolacci S, Barati S, Manara E, et al. Genetic analysis of intellectual disability and autism. Acta Bio-Medica. 2020; 91(13-S):e2020003. [DOI:10.23750/abm.v91i13-S.10684] [PMID]
- Harding KE, Wardle M, Carruthers R, Robertson N, Zhu F, Kingwell E, et al. Socioeconomic status and disability progression in multiple sclerosis: A multinational study. Neurology. 2019; 92(13):e1497-506. [DOI:10.1212/WNL.0000000000007190] [PMID]
- Ani PN, Eze SN, Abugu PI. Socio-demographic factors and health status of adults with disability in enugu metropolis, Nigeria. Malawi Medical Journal. 2021; 33(1):37-47. [DOI:10.4314/mmj.v33i1.6] [PMID]
- Mahmud I, Clarke L, Ploubidis GB. Socio-demographic determinants of the severity of locomotor disability among adults in Bangladesh: A cross-sectional study, December 2010-February 2011. Archives of Public Health. 2017; 75:47. [DOI:10.1186/s13690-017-0217-5] [PMID]
- Soltani S, Khosravi B, Salehiniya H. Prevalence of disability in Iran. Iranian Journal of Public Health. 2015; 44(10):1436-7. [PMID]
- Soltani S, Hafshejani AM, Salehiniya H. Trend of disability prevalence in Iran: An evidence to improve disability data. Journal of Research in Medical Sciences. 2015; 20(5):531-2. [DOI:10.4103/1735-1995.163983] [PMID]
- Ahmadzadeh N, Ebadi Fard Azar F, Baradaran HR, Salman Roghani R, Shirazikhah M, Joghataei MT, et al. Availability of outpatient rehabilitation facilities in 2015 in Iran: A nationwide study. Medical Journal of the Islamic Republic of Iran. 2018; 32:123. [DOI:10.14196/mjiri.32.123] [PMID]
- Rabanifar N, Abdi K. Barriers and challenges of implementing telerehabilitation: A systematic review. Iranian Rehabilitation Journal. 2021; 19(2):121-8. [DOI:10.32598/irj.19.2.1404.1]
- Alavi M, Khodaie Ardakani MR, Moradi-Lakeh M, Sajjadi H, Shati M, Noroozi M, et al. Responsiveness of physical rehabilitation centers in capital of Iran: Disparities and related determinants in public and private sectors. Frontiers in Public Health. 2018; 6:317. [DOI:10.3389/fpubh.2018.00317] [PMID]
- Hosseinpoor AR, Stewart Williams JA, Gautam J, Posarac A, Officer A, Verdes E, et al. Socioeconomic inequality in disability among adults: A multicountry study using the World Health Survey. American Journal of Public Health. 2013; 103(7):1278-86. [DOI:10.2105/AJPH.2012.301115] [PMID]
- Abedzadeh-Kalahroudi M, Razi E, Sehat M. The relationship between socioeconomic status and trauma outcomes. Journal of Public Health. 2018; 40(4):e431-9. [DOI:10.1093/pubmed/fdy033] [PMID]
- Moradi G, Mostafavi F, Hajizadeh M, Amerzade M, Bolbanabad AM, Alinia C, et al. Socioeconomic inequalities in different types of disabilities in Iran. Iranian Journal of Public Health. 2018; 47(3):427. [Link]
- Zitko Melo P, Cabieses Valdes B. Socioeconomic determinants of disability in Chile. Disability and Health Journal. 2011; 4(4):271-82.[DOI:10.1016/j.dhjo.2011.06.002] [PMID]
- Rashidian A, Karimi-Shahanjarini A, Khosravi A, Elahi E, Beheshtian M, Shakibazadeh E, et al. Iran’s multiple indicator demographic and health survey - 2010: Study protocol. International Journal of Preventive Medicine. 2014; 5(5):632-42. [PMID]
- National Institute for Health Research. Iran’s multiple indicator demographic and health survey 2018 [Internet]. 2018 [Updated 2 June 2025]. Available from: [Link]
- Kakwani NC. Measurement of tax progressivity: An international comparison. 1977; 87(345):71-80. [DOI:10.2307/2231833]
- Chakraborty NM, Fry K, Behl R, Longfield K. Simplified asset indices to measure wealth and equity in health programs: A reliability and validity analysis using survey data from 16 countries. Global Health, Science and Practice. 2016; 4(1):141-54. [DOI:10.9745/GHSP-D-15-00384] [PMID]
- Wagstaff A, Paci P, van Doorslaer E. On the measurement of inequalities in health. Social Science & Medicine. 1991; 33(5):545-57. [DOI:10.1016/0277-9536(91)90212-U] [PMID]
- O’Donnell O, O’Neill S, Van Ourti T, Walsh B. conindex: Estimation of concentration indices. The Stata Journal. 2016; 16(1):112-38. [DOI:10.1177/1536867X1601600112] [PMID]
- Wagstaff A, O’Donnell O, Van Doorslaer E, Lindelow M. Analyzing health equity using household survey data: A guide to techniques and their implementation. Washington: World Bank Publications; 2007. [DOI:10.1596/978-0-8213-6933-3]
- Walsh B, Cullinan J, Biology H. Decomposing socioeconomic inequalities in childhood obesity: Evidence from Ireland. Economics and Human Biology. 2015; 16:60-72. [DOI:10.1016/j.ehb.2014.01.003] [PMID]
- Wagstaff A. The bounds of the concentration index when the variable of interest is binary, with an application to immunization inequality. Health Economics. 2005; 14(4):429-32. [DOI:10.1002/hec.953] [PMID]
- Wagstaff A, Van Doorslaer E, Watanabe N. On decomposing the causes of health sector inequalities with an application to malnutrition inequalities in Vietnam. Journal of Econometrics. 2003; 112(1):207-23. [DOI:10.1016/S0304-4076(02)00161-6]
- Soltani S, Arvan K, Karami Matin B, Ghoddoosinejad J, Moradi F, Salehiniya H. People with Disabilities and Financial Challenges in Access to Rehabilitation Services: Evidence of Socioeconomic Inequality in Iran. Medical Journal of the Islamic Republic of Iran. 2024; 38:31. [DOI:10.47176/mjiri.38.31] [PMID]
- Karami B, Rezaei S, Gillan HD, Akbari S, Maleki R, Moradi F, et al. Inpatient healthcare utilization among people with disabilities in Iran: Determinants and inequality patterns. BMC Health Services Research. 2024; 24(1):62. [DOI:10.1186/s12913-023-10383-0] [PMID]
- Mansouri A, Emamian MH, Zeraati H, Hashemi H, Fotouhi A. Economic inequality in presenting vision in shahroud, iran: two decomposition methods. International Journal of Health Policy and Management. 2018; 7(1):59-69. [DOI:10.15171/ijhpm.2017.48] [PMID]
- Emamian MH, Zeraati H, Majdzadeh R, Shariati M, Hashemi H, Fotouhi A. The gap of visual impairment between economic groups in Shahroud, Iran: a Blinder-Oaxaca decomposition. American Journal of Epidemiology. 2011; 173(12):1463-7. [DOI:10.1093/aje/kwr050] [PMID]
- Thomas P, Zahorodny W, Peng B, Kim S, Jani N, Halperin W, et al. The association of autism diagnosis with socioeconomic status. Autism. 2012; 16(2):201-13. [DOI:10.1177/1362361311413397] [PMID]
- Freedman VA, Martin LG. Understanding trends in functional limitations among older Americans. American Journal of Public Health. 1998; 88(10):1457-62. [DOI:10.2105/AJPH.88.10.1457] [PMID]
- Liu H, Wang M. Socioeconomic status and ADL disability of the older adults: Cumulative health effects, social outcomes and impact mechanisms. Plos One. 2022; 17(2):e0262808. [DOI:10.1371/journal.pone.0262808] [PMID]
- Najafi F, Soltani S, Karami Matin B, Kazemi Karyani A, Rezaei S, Soofi M, et al. Socioeconomic - related inequalities in overweight and obesity: Findings from the PERSIAN cohort study. BMC Public Health. 2020; 20(1):214. [DOI:10.1186/s12889-020-8322-8] [PMID]
- Wilkinson RG, Marmot M. Social determinants of health: The solid facts. Geneva: World Health Organization; 2003. [Link]
- Cutler DM, Lleras-Muney A. Understanding differences in health behaviors by education. Journal of Health Economics. 2010; 29(1):1-28. [DOI:10.1016/j.jhealeco.2009.10.003] [PMID]
- Anderson CD, Nalls MA, Biffi A, Rost NS, Greenberg SM, Singleton AB, et al. The effect of survival bias on case-control genetic association studies of highly lethal diseases. Circulation. Cardiovascular Genetics. 2011; 4(2):188-96. [DOI:10.1161/CIRCGENETICS.110.957928] [PMID]
- Richardson JL, Langholz B, Bernstein L, Burciaga C, Danley K, Ross RK. Stage and delay in breast cancer diagnosis by race, socioeconomic status, age and year. British Journal of Cancer. 1992; 65(6):922-6. [DOI:10.1038/bjc.1992.193] [PMID]
- Kazemi Karyani A, Karmi Matin B, Soltani S, Rezaei S, Soofi M, Salimi Y, et al. Socioeconomic gradient in physical activity: findings from the PERSIAN cohort study. BMC Public Health. 2019; 19(1):1312. [DOI:10.1186/s12889-019-7715-z] [PMID]
- Ramadass S, Rai SK, Gupta SK, Kant S, Wadhwa S, Sood M, et al. Prevalence of disability and its association with sociodemographic factors and quality of life in India: A systematic review. Journal of Family Medicine and Primary Care. 2018; 7(6):1177-84. [DOI:10.4103/jfmpc.jfmpc_10_18] [PMID]
- Klijs B, Nusselder WJ, Looman CW, Mackenbach JP. Educational disparities in the burden of disability: contributions of disease prevalence and disabling impact. American Journal of Public Health. 2014; 104(8):e141-e8. [DOI:10.2105/AJPH.2014.301924] [PMID]
- Courtney-Long EA, Carroll DD, Zhang QC, Stevens AC, Griffin-Blake S, Armour BS, et al. Prevalence of disability and disability type among adults--United States, 2013. MMWR. Morbidity and Mortality Weekly Report 2015; 64(29):777-83. [DOI:10.15585/mmwr.MM6429a2] [PMID]
- Zunzunegui MV, Nunez O, Durban M, de Yébenes M-JG, Otero Á. Decreasing prevalence of disability in activities of daily living, functional limitations and poor self-rated health: a 6-year follow-up study in Spain. Aging Clinical and Experimental Research. 2006; 18(5):352-8. [DOI:10.1007/BF03324830] [PMID]
- Rodriguez-Laso A, Abellan A, Sancho M, Pujol R, Montorio I, Diaz-Veiga P. Perceived economic situation, but not education level, is associated with disability prevalence in the Spanish elderly: observational study. BMC Geriatrics. 2014; 14(1):60. [DOI:10.1186/1471-2318-14-60] [PMID]
Type of Study: Original |
Subject:
Rehabilitation Management
Received: 19/04/2024 | Accepted: 26/11/2024 | Published: 1/07/2025
Received: 19/04/2024 | Accepted: 26/11/2024 | Published: 1/07/2025
Send email to the article author
| Rights and permissions | |
 |
This work is licensed under a Creative Commons Attribution-NonCommercial 4.0 International License. |
Copyright © The Author(s);
This is an open access article distributed under the terms of the Creative Commons Attribution-NonCommercial 4.0 (CC-By-NC 4.0), which permits use, distribution, and reproduction in any medium, provided the original work is properly cited and is not used for commercial purposes.
Contact Information
This is an open access article distributed under the terms of the Creative Commons Attribution-NonCommercial 4.0 (CC-By-NC 4.0), which permits use, distribution, and reproduction in any medium, provided the original work is properly cited and is not used for commercial purposes.
Contact Information